Introduction
Northern blotting is a molecular biology technique used to detect, identify, and study RNA molecules (mainly mRNA) within a sample.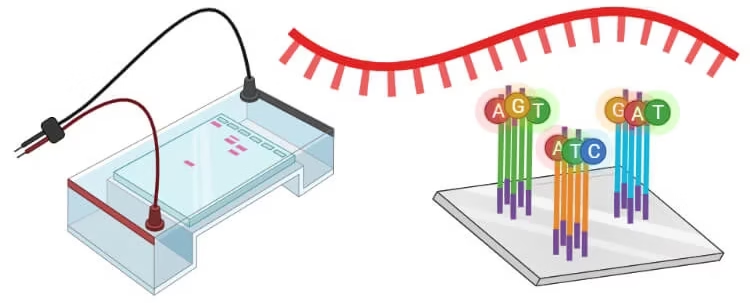
-
It was developed by James Alwine, David Kemp, and George Stark in 1977.
-
The name “Northern blot” was coined as an analogy to the Southern blot (a method for DNA detection developed by Edwin Southern).
-
Since it focuses on RNA, it plays a crucial role in gene expression studies because mRNA reflects which genes are actively being transcribed in a cell or tissue at a given time.
👉 In short:
Northern blotting is a hybridization-based method that separates RNA by size and detects specific RNA sequences using complementary nucleic acid probes.
Principle
The principle of Northern blotting relies on nucleic acid hybridization:
-
RNA Separation:
-
RNA molecules are separated by size using agarose gel electrophoresis (with formaldehyde or glyoxal to denature RNA).
-
-
Transfer to Membrane:
-
The separated RNA fragments are transferred to a nylon or nitrocellulose membrane.
-
-
Fixation:
-
RNA is immobilized on the membrane by UV cross-linking or baking.
-
-
Hybridization with a Labeled Probe:
-
A single-stranded DNA or RNA probe, complementary to the target RNA sequence, is labeled (radioactive, fluorescent, or chemiluminescent).
-
This probe hybridizes specifically to its complementary RNA sequence on the membrane.
-
-
Detection:
-
The hybridized probe is detected by autoradiography, fluorescence, or chemiluminescence.
-
The signal corresponds to the presence, size, and abundance of the RNA of interest.
-
Steps of Northern Blotting
Step 1: Sample Preparation
-
Extract total RNA or mRNA from cells/tissues using methods such as TRIzol reagent, phenol–chloroform extraction, or column-based kits.
-
RNA integrity is checked using agarose gel electrophoresis or a bioanalyzer.
-
RNA is very sensitive to RNases, so all steps must be performed with RNase-free reagents and equipment.
Step 2: Gel Electrophoresis
-
RNA samples are denatured to prevent secondary structure formation.
-
They are separated on agarose gel containing formaldehyde or glyoxal (denaturing agents).
-
Separation is based on size (nucleotide length).
-
Ethidium bromide or SYBR Green may be used to visualize RNA migration.
📌 Example: A 2 kb mRNA will migrate slower than a 0.8 kb mRNA.
Step 3: Transfer to Membrane
-
After electrophoresis, RNA is transferred from the gel to a nylon or nitrocellulose membrane.
-
Methods:
-
Capillary transfer (classic method): Buffer moves upward by capillary action, carrying RNA from gel to membrane.
-
Vacuum or electroblotting: Faster, more efficient alternatives.
-
Step 4: Fixation
-
RNA molecules are covalently bound to the membrane:
-
UV Crosslinking (most common): RNA is exposed to UV light.
-
Baking: Membrane heated at 80 °C.
-
Step 5: Hybridization with Probe
-
A labeled probe (complementary to target RNA) is prepared.
-
Types of probes:
-
Radioactive probes (e.g., ³²P-labeled DNA or RNA).
-
Non-radioactive probes (fluorescent, digoxigenin (DIG)-labeled, biotin-labeled).
-
-
Membrane is incubated with probe under conditions that allow specific base pairing (hybridization).
Step 6: Washing
-
Excess unbound probe is removed by washing with buffer under stringent conditions.
-
Ensures only specific hybridization signals remain.
Step 7: Detection
-
Depending on the probe label:
-
Autoradiography: X-ray film detects radioactive probe.
-
Fluorescence Imaging: For fluorescent probes.
-
Chemiluminescence: Probe coupled with enzyme that emits light upon substrate addition.
-
Step 8: Analysis
-
The detected signal appears as bands on film or an imaging system.
-
Band position: Indicates RNA size (compared to RNA ladder).
-
Band intensity: Reflects relative abundance of mRNA.
📌 Example: If a cancer cell expresses more c-myc mRNA, a stronger band will appear in tumor samples compared to normal samples.
Results Interpretation
-
Presence/absence of bands: Confirms whether the target RNA is expressed.
-
Size of band: Indicates transcript length (e.g., splicing variants, processing events).
-
Band intensity: Provides relative measure of transcript abundance.
-
Multiple bands: May indicate different isoforms or alternative splicing products.
-
Controls used:
-
Loading controls (e.g., 18S rRNA, GAPDH mRNA): To ensure equal RNA loading across lanes.
-
Negative controls: To check probe specificity.
-
Positive controls: To confirm probe functionality.
-
Applications
1 Gene Expression Studies
-
Detects specific mRNA levels in different cell types, tissues, or developmental stages.
-
Example: Comparing β-globin mRNA in fetal vs. adult tissues.
2 Alternative Splicing Analysis
-
Identifies splice variants by revealing transcripts of different sizes.
-
Example: Tropomyosin gene produces multiple isoforms; Northern blot distinguishes them.
3 RNA Processing Studies
-
Studies pre-mRNA splicing, polyadenylation, and degradation.
-
Example: Detecting unspliced vs. spliced transcripts in mutant cells.
4 Verification of Gene Expression
-
Confirms whether a cloned gene is transcribed in transfected cells.
5 Disease Diagnosis and Research
-
Used to detect viral RNAs in infections.
-
Example: Detecting hepatitis C virus RNA in patient samples.
6 Drug Development
-
Helps study changes in gene expression upon drug treatment.
-
Example: Testing whether a chemotherapy drug downregulates oncogene mRNAs.
Advantages
-
Provides information on RNA size and abundance.
-
Highly specific (probe-based detection).
-
Can detect alternative splicing and isoforms.
-
Useful for validating results of other techniques (RT-PCR, microarrays).
-
Stable record (blots can be stored and re-probed).
Limitations
-
Labor-intensive and time-consuming.
-
Requires large amounts of RNA compared to RT-PCR.
-
Lower sensitivity compared to qRT-PCR or RNA-seq.
-
Use of radioactivity poses safety concerns.
-
Requires high-quality, intact RNA (easily degraded by RNases).
Comparison with Other Techniques
| Feature | Northern Blot | RT-PCR/qRT-PCR | RNA-seq |
|---|---|---|---|
| Information | RNA size + abundance | Abundance (quantitative) | Abundance + sequence |
| Sensitivity | Moderate | Very high | Very high |
| Throughput | Low (one/few genes) | Moderate (targeted genes) | High (whole transcriptome) |
| Cost | Moderate | Moderate | High |
| Use | Validation, size analysis | Expression quantification | Global transcriptome analysis |