
Caloric Value of Foods
-
Maintenance of vital functions
-
Physical activity
-
Growth and tissue repair
-
Thermoregulation
Energy is expressed in kilocalories (kcal).
1 kilocalorie (kcal) = Heat required to raise the temperature of 1 kilogram of water by 1°C.
In modern nutrition science, we often use the term Calorie (C) to mean kilocalorie.
Types of Caloric Value
1. Gross Caloric Value
-
Measured using a bomb calorimeter
-
Food is completely burned in oxygen
-
Measures total heat produced
This value is higher than what the body actually uses.
2. Physiological (Metabolizable) Caloric Value
-
Actual energy available to the body
-
Accounts for:
-
Incomplete digestion
-
Loss of nitrogen in urine (in case of protein)
-
This is the value used in diet planning.
Energy Yield of Macronutrients
| Nutrient | Gross Energy (kcal/g) | Physiological Value (kcal/g) |
|---|---|---|
| Carbohydrates | 4.1 | 4 |
| Proteins | 5.65 | 4 |
| Fats | 9.45 | 9 |
| Alcohol | 7 | 7 |
Important Points:
Carbohydrates
-
Primary source of energy
-
Quickly metabolized
-
Stored as glycogen
Proteins
-
Provide 4 kcal/g
-
Energy use is secondary (main role is structural & functional)
-
Some energy lost in urea formation
Fats
-
Most concentrated energy source
-
Provide more than double energy compared to carbohydrates
-
Major energy reserve in adipose tissue
Measurement of Caloric Value
A. Direct Calorimetry
-
Measures heat produced directly
-
Uses insulated chamber
-
Rarely used clinically
B. Indirect Calorimetry
-
Based on oxygen consumption and CO₂ production
-
More practical
-
Used in ICU and metabolic studies
Principle:
Energy production is proportional to oxygen consumption.
Factors Affecting Energy Yield from Food
-
Digestibility of food
-
Fiber content
-
Processing of food
-
Individual metabolic state
-
Disease conditions
Example:
-
High-fiber foods yield slightly less usable calories.
-
Malabsorption reduces caloric availability.
Daily Caloric Requirement
Energy requirement depends on:
-
Age
-
Sex
-
Body weight
-
Physical activity
-
Physiological state (pregnancy, lactation)
Average Requirement:
| Category | kcal/day |
|---|---|
| Adult male | 2400–2800 |
| Adult female | 1800–2200 |
| Sedentary adult | Lower range |
| Heavy worker | Higher range |
Balanced Diet
A balanced diet is one that provides all essential nutrients in adequate quantity and appropriate proportion to maintain optimal health, growth, and metabolic function.
It must supply:
-
Energy
-
Body-building nutrients
-
Protective nutrients
-
Regulatory substances
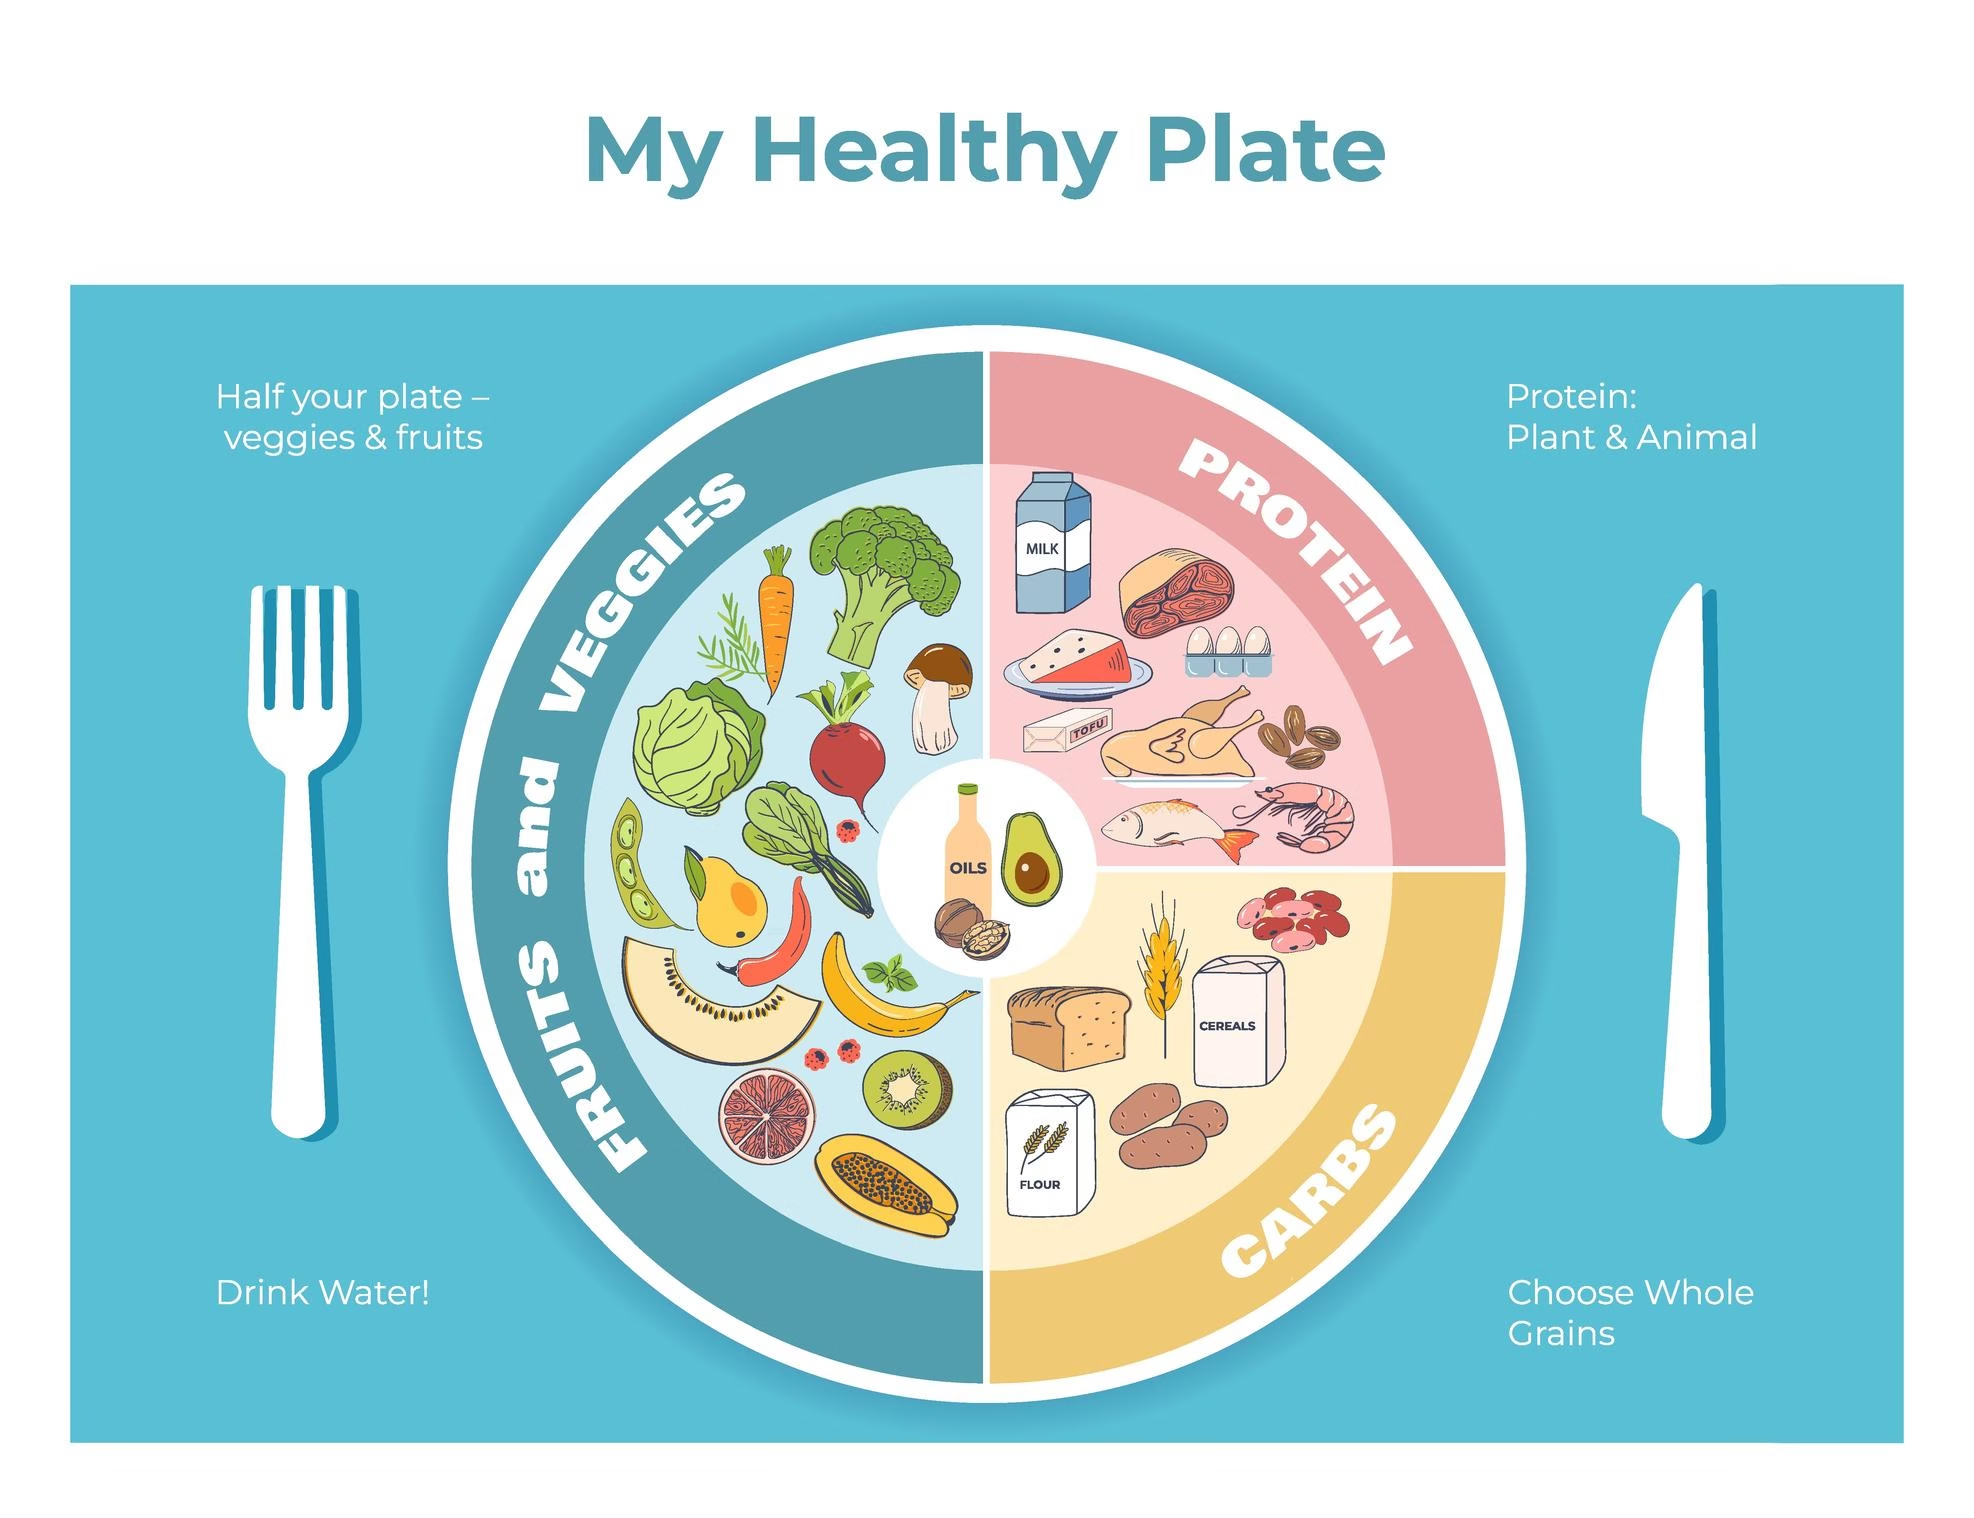
Components of a Balanced Diet
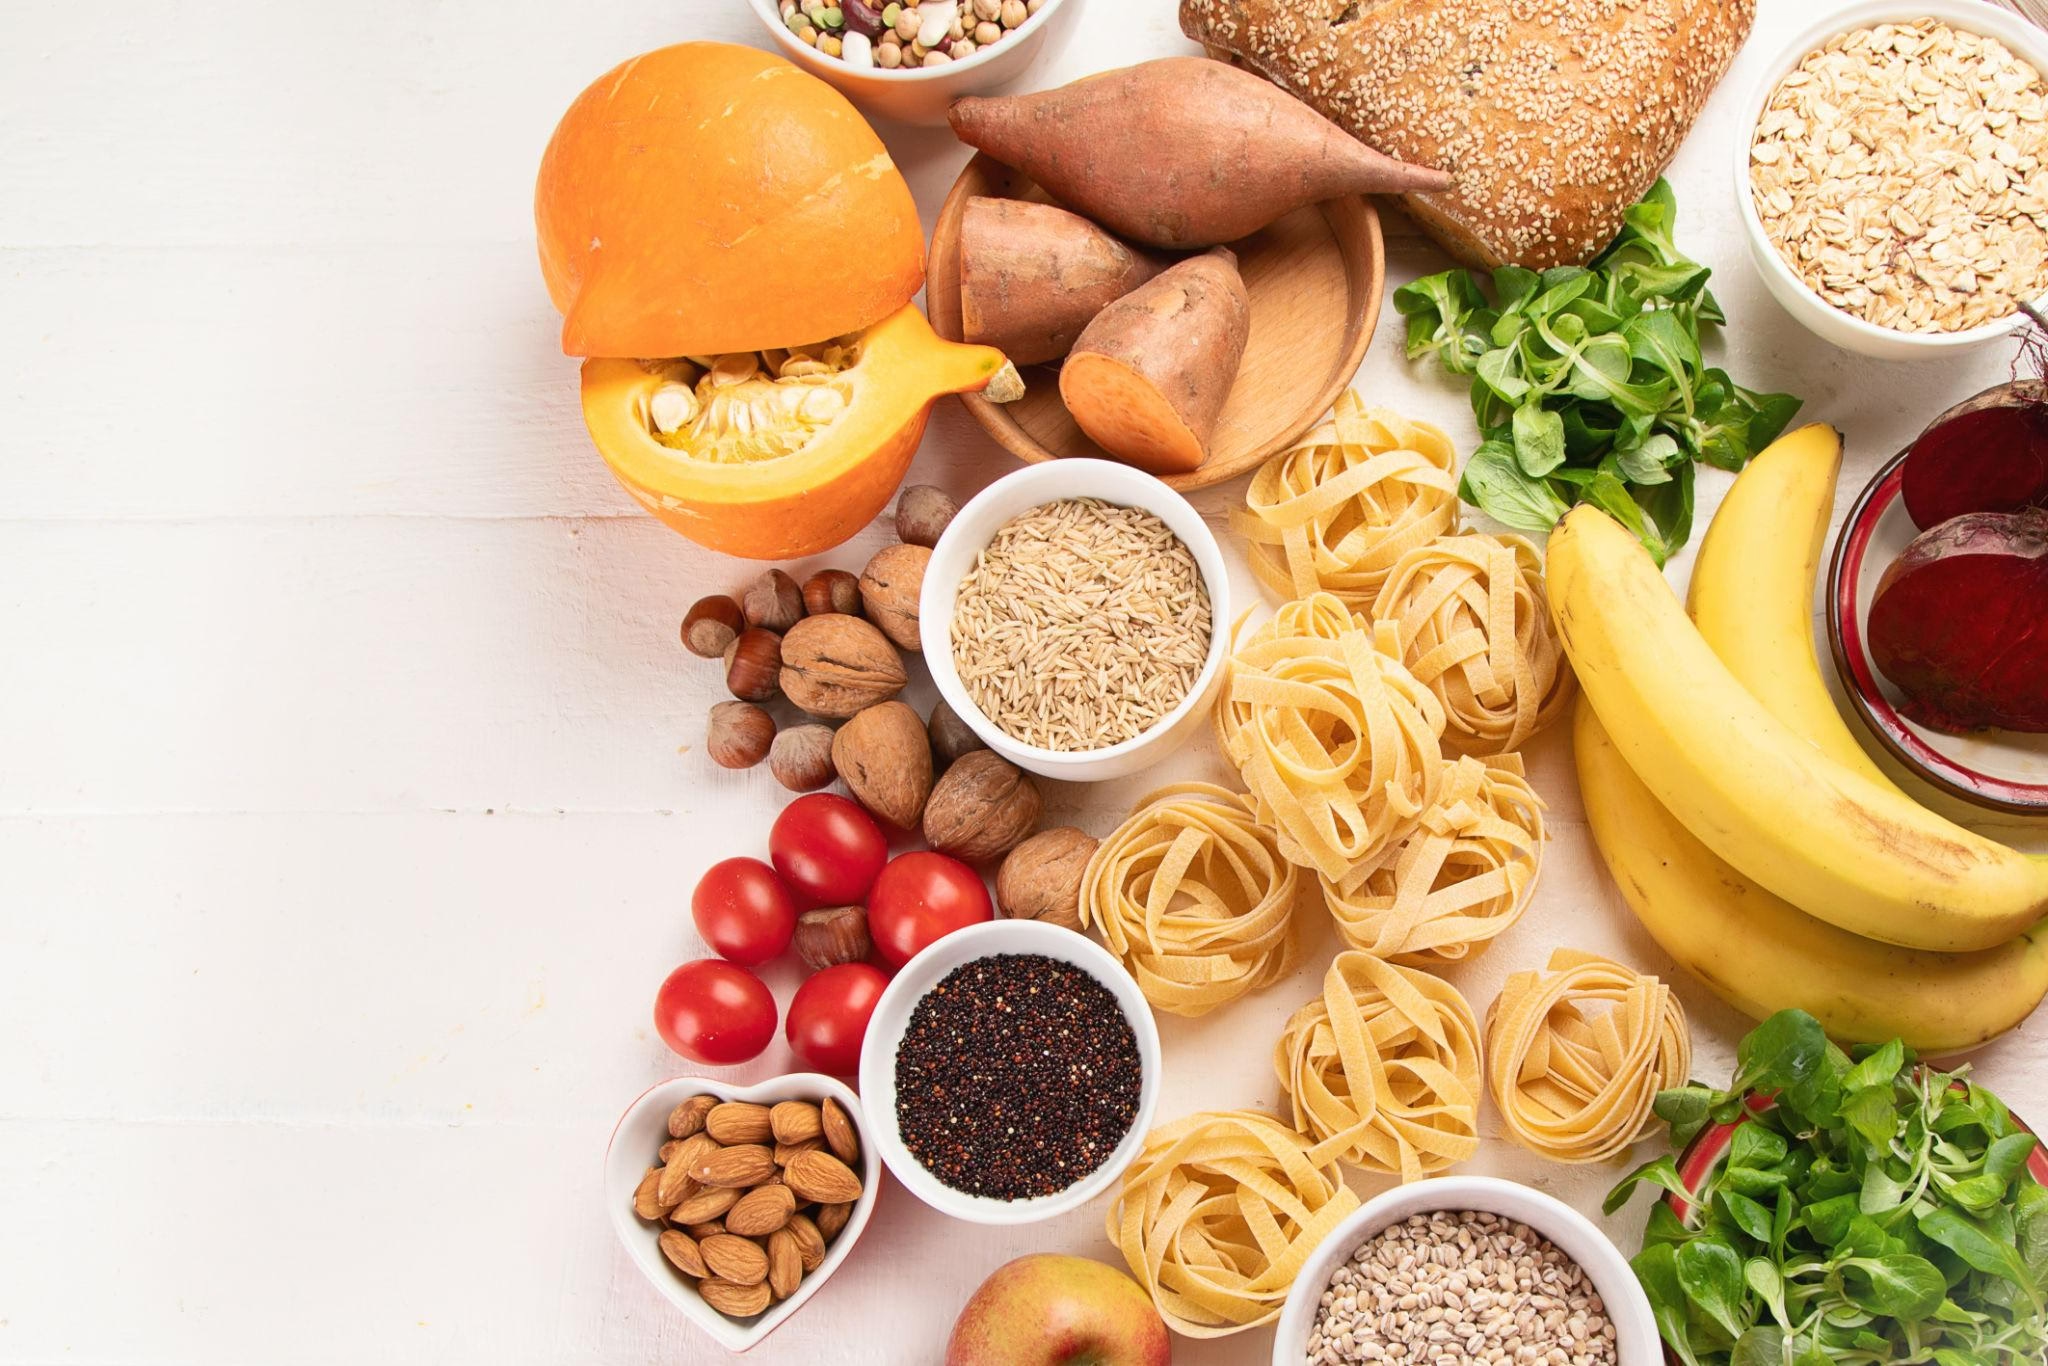
1. Carbohydrates (50–60%)
-
Main source of energy
-
Prevent protein breakdown (protein-sparing action)
-
Maintain blood glucose levels
Sources: Cereals, rice, wheat, fruits, and vegetables.
2. Proteins (10–15%)
-
Supply essential amino acids
-
Required for enzymes, hormones, antibodies
-
Important for growth and tissue repair
Sources: Pulses, soybeans, milk, paneer, legumes (especially important in vegetarian diets).
3. Fats (20–30%)
-
Concentrated energy source
-
Provide essential fatty acids
-
Aid absorption of fat-soluble vitamins (A, D, E, K)
Sources: Vegetable oils, nuts, seeds.
4. Vitamins
-
Act as coenzymes
-
Regulate metabolic pathways
5. Minerals
-
Structural role (Ca, P)
-
Functional role (Fe in hemoglobin)
6. Water
-
Solvent for biochemical reactions
-
Maintains fluid balance
7. Dietary Fiber
-
Improves bowel motility
-
Reduces cholesterol
-
Controls blood glucose
Characteristics of a Balanced Diet
-
Adequate calories
-
Proper macronutrient ratio
-
Contains protective foods
-
Easily digestible
-
Culturally acceptable
Importance
-
Maintains immune system
-
Prevents malnutrition
-
Reduces chronic diseases
-
Promotes healthy growth
Protein Energy Malnutrition
Protein Energy Malnutrition (PEM) is a spectrum of nutritional disorders resulting from deficiency of protein and/or total caloric intake, most commonly seen in infants and young children.
It is a major public health problem in developing countries and contributes significantly to child morbidity and mortality.
Causes
Inadequate Intake
-
Poverty
-
Improper weaning
-
Diluted milk feeds
-
Lack of protein-rich foods
Increased Requirement
-
Rapid growth period
-
Pregnancy
-
Infections
Malabsorption
-
Chronic diarrhea
-
Intestinal parasites
Chronic Illness
-
Tuberculosis
-
Congenital heart disease
-
HIV
Classification of PEM
PEM exists on a spectrum from mild undernutrition to severe forms:
Marasmus
Cause
Severe deficiency of total calories (both protein and energy).
Clinical Features
-
Severe muscle wasting
-
Loss of subcutaneous fat
-
“Skin and bones” appearance
-
No edema
-
Irritable but alert
-
Growth retardation
Biochemical Changes
-
Low insulin levels
-
Increased cortisol
-
Mild decrease in serum albumin
-
Increased ketone bodies
🔹 Pathophysiology
Energy deficiency → Mobilization of fat & muscle → Severe wasting
Kwashiorkor
Cause
Severe protein deficiency with relatively adequate calorie intake.
Clinical Features
-
Edema (due to hypoalbuminemia)
-
Moon face
-
Distended abdomen
-
Fatty liver
-
Hair discoloration (“flag sign”)
-
Dermatitis (flaky paint appearance)
-
Apathy
Biochemical Changes
-
Severe hypoalbuminemia
-
Reduced plasma proteins
-
Decreased apoprotein synthesis
-
Fat accumulation in liver
Pathophysiology
↓ Protein intake → ↓ Albumin → ↓ Oncotic pressure → Edema
↓ Lipoprotein synthesis → Fatty liver
Marasmic-Kwashiorkor
Mixed features of both marasmus and kwashiorkor.
Comparison: Marasmus vs Kwashiorkor
| Feature | Marasmus | Kwashiorkor |
|---|---|---|
| Cause | Calorie deficiency | Protein deficiency |
| Edema | Absent | Present |
| Fat stores | Severely depleted | Relatively preserved |
| Serum albumin | Mildly reduced | Markedly reduced |
| Fatty liver | Absent | Present |
| Appearance | Emaciated | Edematous |
Pathophysiology
Hypoproteinemia
-
Reduced albumin synthesis
-
Decreased plasma oncotic pressure
-
Edema formation
Fatty Liver
-
Reduced apoprotein synthesis
-
Impaired VLDL formation
-
Fat accumulation in hepatocytes
Immune Suppression
-
Decreased antibody production
-
Reduced T-cell function
-
Increased infections
Hormonal Adaptation
-
↓ Insulin
-
↑ Cortisol
-
↓ Thyroid hormones (adaptive)
Laboratory Findings
-
Low serum albumin
-
Low total protein
-
Anemia (often iron deficiency)
-
Electrolyte imbalance
-
Hypoglycemia (severe cases)
Nitrogen Balance
Nitrogen balance is the difference between nitrogen intake and nitrogen loss from the body.
Since protein is the only major dietary source of nitrogen, nitrogen balance is an important indicator of protein nutritional status.
Nitrogen Loss Occurs Through:
-
Urine (major route – as urea, creatinine, uric acid)
-
Feces
-
Sweat
-
Skin and hair shedding
Urinary nitrogen is the most significant component and is measured clinically.
Types of Nitrogen Balance
Positive Nitrogen Balance
Nitrogen intake > Nitrogen loss
Protein synthesis exceeds protein breakdown.
Seen In:
-
Growth (children, adolescents)
-
Pregnancy
-
Lactation
-
Recovery from illness
-
Muscle building
-
Anabolic hormone therapy
Biochemical Significance
-
Increased protein synthesis
-
Tissue formation
-
Net gain of body protein
Negative Nitrogen Balance
Nitrogen loss > Nitrogen intake
Protein breakdown exceeds synthesis.
Seen In:
-
Starvation
-
Severe trauma
-
Burns
-
Sepsis
-
Cancer
-
Uncontrolled diabetes
-
Protein Energy Malnutrition
Biochemical Changes
-
Increased cortisol
-
Increased proteolysis
-
Increased urea excretion
-
Loss of lean body mass
Zero (Neutral) Nitrogen Balance
Nitrogen intake = Nitrogen loss
Seen In:
-
Healthy adults
-
Stable metabolic state
Mechanism of Nitrogen Balance
Protein metabolism involves:
-
Amino acid pool
-
Protein synthesis
-
Protein degradation
-
Urea formation in liver
When breakdown exceeds synthesis → negative balance
When synthesis exceeds breakdown → positive balance
Clinical Applications
Assessment of Nutritional Status
Used in:
-
ICU patients
-
Post-operative patients
-
Burn patients
-
Dialysis patients
Determining Protein Requirement
Helps calculate optimal protein intake in:
-
Critically ill patients
-
Athletes
-
Chronic kidney disease (adjusted requirement)
Monitoring Catabolic State
In trauma or infection:
-
Increased urinary urea nitrogen
-
Indicates high protein breakdown
Clinical Interpretation
| Nitrogen Balance | Interpretation | Clinical Condition |
|---|---|---|
| Positive | Anabolic state | Growth, recovery |
| Negative | Catabolic state | Trauma, PEM |
| Zero | Stable state | Healthy adult |
Factors Affecting Nitrogen Balance
-
Protein intake
-
Calorie intake
-
Hormonal status (insulin, cortisol)
-
Infection
-
Trauma
-
Burn injury
-
Chronic diseases
-
Exercise
Hormonal Influence
-
Insulin → Promotes positive nitrogen balance
-
Growth hormone → Protein synthesis
-
Testosterone → Anabolic
-
Cortisol → Negative nitrogen balance
Basal Metabolic Rate
Basal Metabolic Rate (BMR) is the minimum amount of energy required to maintain vital body functions at complete physical and mental rest, in the post-absorptive state and under thermoneutral conditions.
It represents the energy needed for:
-
Heart beating
-
Breathing
-
Kidney function
-
Brain activity
-
Maintenance of body temperature
-
Ion transport across membranes
BMR accounts for 60–70% of total daily energy expenditure in sedentary individuals.
Conditions for Measuring BMR
To measure true BMR, the following conditions must be met:
-
Post-absorptive state (12 hours fasting)
-
Complete physical rest
-
Mental relaxation
-
Comfortable environmental temperature (thermoneutral zone)
-
No recent illness or stress
Normal Values
-
Adult males → ~24 kcal/kg/day
-
Adult females → ~22 kcal/kg/day
Example:
70 kg male → 70 × 24 = 1680 kcal/day
Physiological Basis of BMR
Energy during basal state is mainly used for:
-
Cellular metabolism (ATP production)
-
Na⁺/K⁺ ATPase activity
-
Protein turnover
-
Liver metabolism
-
Brain glucose utilization
Major organs contributing to BMR:
-
Liver (~20–25%)
-
Brain (~20%)
-
Skeletal muscle (~18–20%)
-
Heart (~8–10%)
-
Kidneys (~7–10%)
Measurement of BMR
Direct Calorimetry
-
Measures heat produced by body.
-
Rarely used (expensive).
Indirect Calorimetry
-
Measures oxygen consumption and CO₂ production.
-
More practical.
-
Based on principle:
Energy production ∝ Oxygen consumption.
Factors Affecting BMR
Age
-
High in infants and children.
-
Declines with age due to decreased lean body mass.
Sex
-
Higher in males (greater muscle mass).
-
Lower in females (higher fat percentage).
Body Composition
-
Lean body mass ↑ BMR.
-
Fat tissue has low metabolic activity.
Hormonal Status
🔹 Thyroid Hormone
-
-
Major regulator of BMR.
-
Hyperthyroidism → Increased BMR.
-
Hypothyroidism → Decreased BMR.
-
🔹 Catecholamines
Increase metabolic rate.
🔹 Growth Hormone
Anabolic effect.
Fever
- BMR increases by 10–13% per 1°C rise in body temperature.
Pregnancy & Lactation
- Increased metabolic demand → Increased BMR.
Climate
- Cold climate → Increased BMR (thermogenesis).
Hot climate → Slight reduction.
Malnutrition & Starvation
-
Decreases BMR (adaptive mechanism).
-
Seen in Protein Energy Malnutrition.
Sleep
- Slight decrease in metabolic rate.
Emotional Stress
- Sympathetic stimulation → Increased BMR.
Clinical Importance of BMR
Obesity
-
Helps calculate calorie requirement.
-
Guides weight loss programs.
Thyroid Disorders
-
Increased BMR → Hyperthyroidism.
-
Decreased BMR → Hypothyroidism.
ICU Patients
-
Prevent overfeeding or underfeeding.
-
Used in nutritional planning.
Starvation & PEM
-
BMR decreases as adaptive response.
Respiratory Quotient
Respiratory Quotient (RQ) is the ratio of carbon dioxide (CO₂) produced to oxygen (O₂) consumed during metabolism.
RQ = CO₂ produced / O₂ consumed
It indicates which type of nutrient is being oxidized in the body.
Biochemical Basis
When nutrients are oxidized:
-
Carbohydrates produce equal CO₂ and consume equal O₂.
-
Fats consume more O₂ than CO₂ produced.
-
Proteins fall in between.
Example:
Glucose oxidation:
C6H12O6+6O2→6CO2+6H2O
RQ Values of Nutrients
| Nutrient | RQ Value |
|---|---|
| Carbohydrates | 1.0 |
| Fats | 0.7 |
| Proteins | 0.8 |
| Mixed diet | 0.8–0.85 |
Clinical Significance
-
Determines substrate utilization
-
Used in indirect calorimetry
-
Helps assess overfeeding
-
RQ > 1 indicates lipogenesis
-
RQ < 0.7 indicates fat oxidation
RQ in Special Conditions
-
Starvation → Low RQ (~0.7)
-
High carbohydrate diet → RQ near 1
-
Diabetes → Lower RQ (fat oxidation dominant)
Specific Dynamic Action
Specific Dynamic Action (SDA), also called the Thermic Effect of Food (TEF), is the increase in metabolic rate after ingestion of food.
It represents energy required for:
-
Digestion
-
Absorption
-
Transport
-
Metabolism
-
Storage of nutrients
SDA of Nutrients
| Nutrient | SDA (%) |
|---|---|
| Protein | 30% |
| Carbohydrate | 5–10% |
| Fat | 5% |
Protein has highest SDA due to:
-
Deamination
-
Urea synthesis
-
Increased protein turnover
Mechanism
After protein intake:
-
Increased amino acid oxidation
-
Increased hepatic urea synthesis
-
Increased thermogenesis
Clinical Importance
-
Important in weight management
-
Explains higher satiety with protein-rich diet
-
Included in total energy expenditure
Total Energy Expenditure (TEE) = BMR + Physical Activity + SDA
Major Dietary Constituents
Macronutrients
1. Carbohydrates
-
Primary energy source
-
4 kcal/g
-
Stored as glycogen
-
Prevent ketosis
Sources: Cereals, fruits, vegetables.
2. Proteins
-
Body-building nutrient
-
4 kcal/g
-
Provide essential amino acids
-
Maintain nitrogen balance
Sources: Pulses, milk, soybeans, legumes.
3. Fats
-
Concentrated energy source (9 kcal/g)
-
Essential fatty acids
-
Carry fat-soluble vitamins
-
Structural role in cell membranes
Sources: Vegetable oils, nuts, seeds.
Micronutrients
4. Vitamins
-
Fat-soluble (A, D, E, K)
-
Water-soluble (B-complex, C)
-
Act as coenzymes
5. Minerals
-
Major (Ca, P, Na, K)
-
Trace (Fe, Zn, Iodine)
Functions:
-
Bone formation
-
Oxygen transport
-
Hormone synthesis
6. Water
-
Solvent
-
Thermoregulation
-
Transport medium
Importance of Dietary Fiber
Dietary fiber is the indigestible portion of plant foods that resists digestion in the small intestine.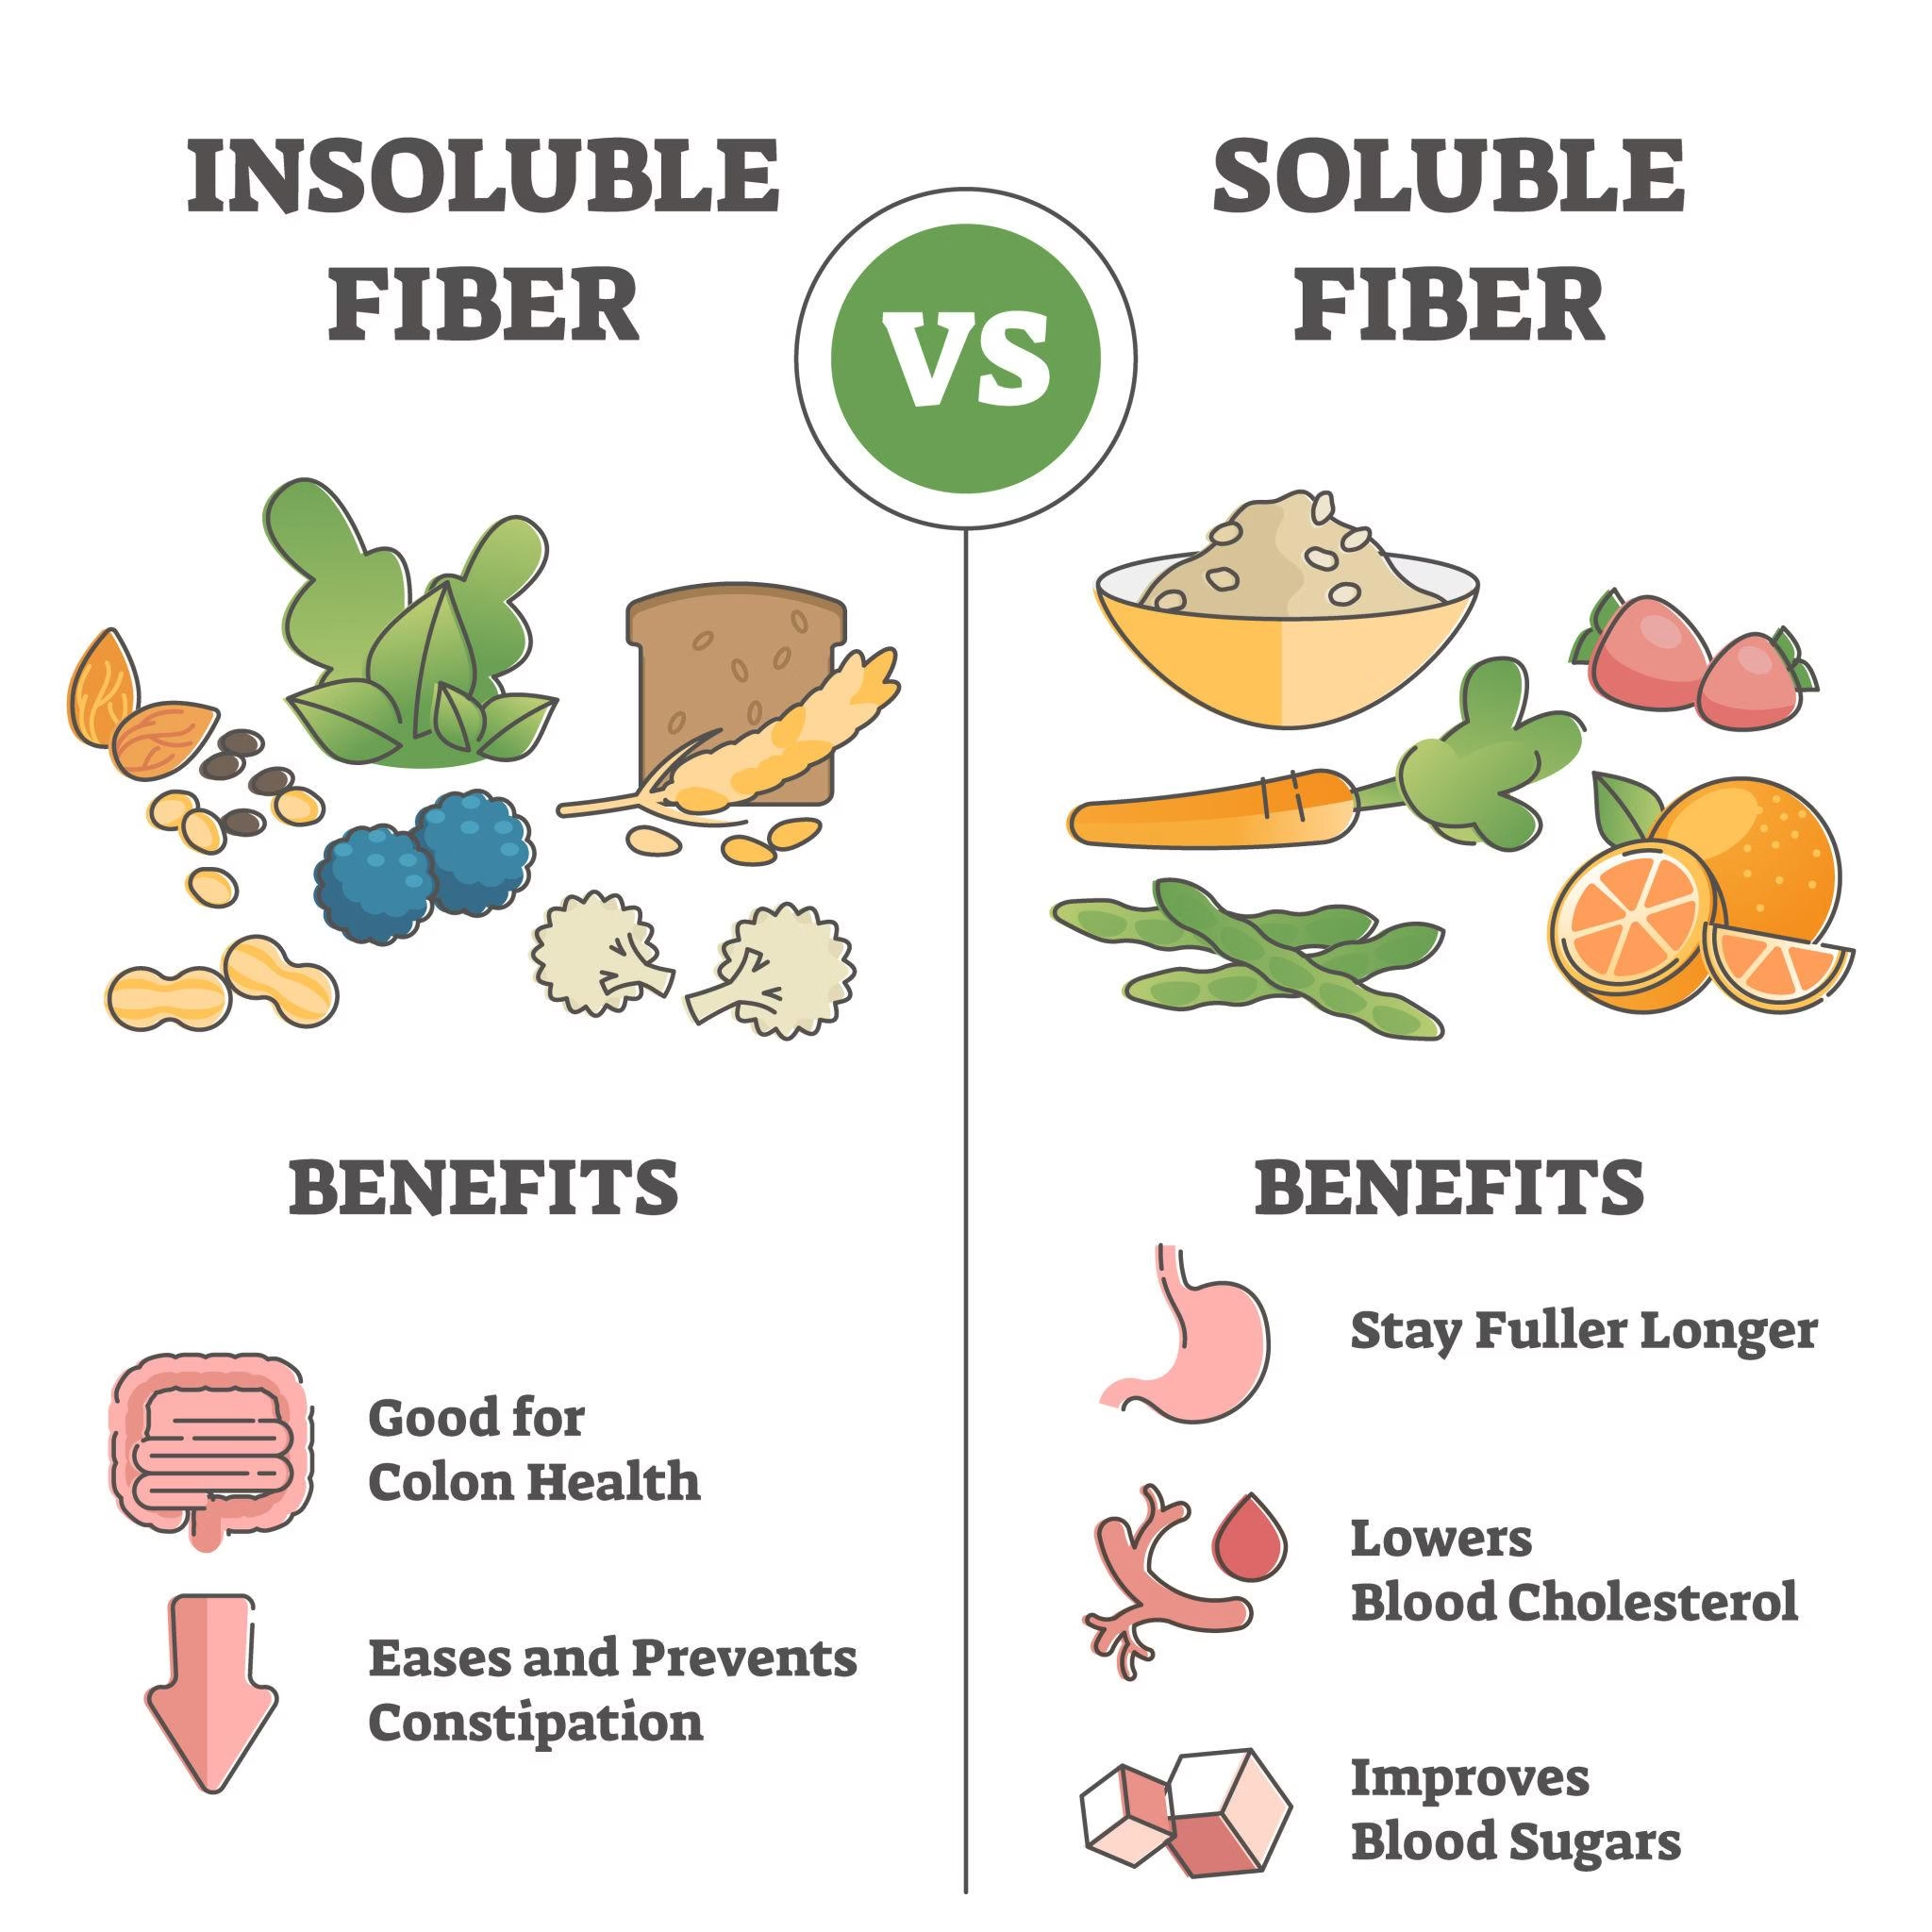
Types
Soluble Fiber
-
Dissolves in water
-
Forms gel
-
Fermented by gut bacteria
Examples: Oats, fruits, legumes.
Insoluble Fiber
-
Does not dissolve
-
Adds bulk to stool
-
Prevents constipation
Examples: Whole grains, vegetables.
Mechanism of Action
-
Increases stool bulk
-
Decreases intestinal transit time
-
Binds bile acids
-
Reduces cholesterol
-
Slows glucose absorption
-
Fermented to short-chain fatty acids (SCFA)
Health Benefits
-
Prevents constipation
-
Reduces risk of colon cancer
-
Controls blood glucose
-
Lowers LDL cholesterol
-
Promotes satiety
-
Reduces obesity risk
Recommended Intake
25–40 grams/day